Attack Surge Detection - Am I Under Attack?
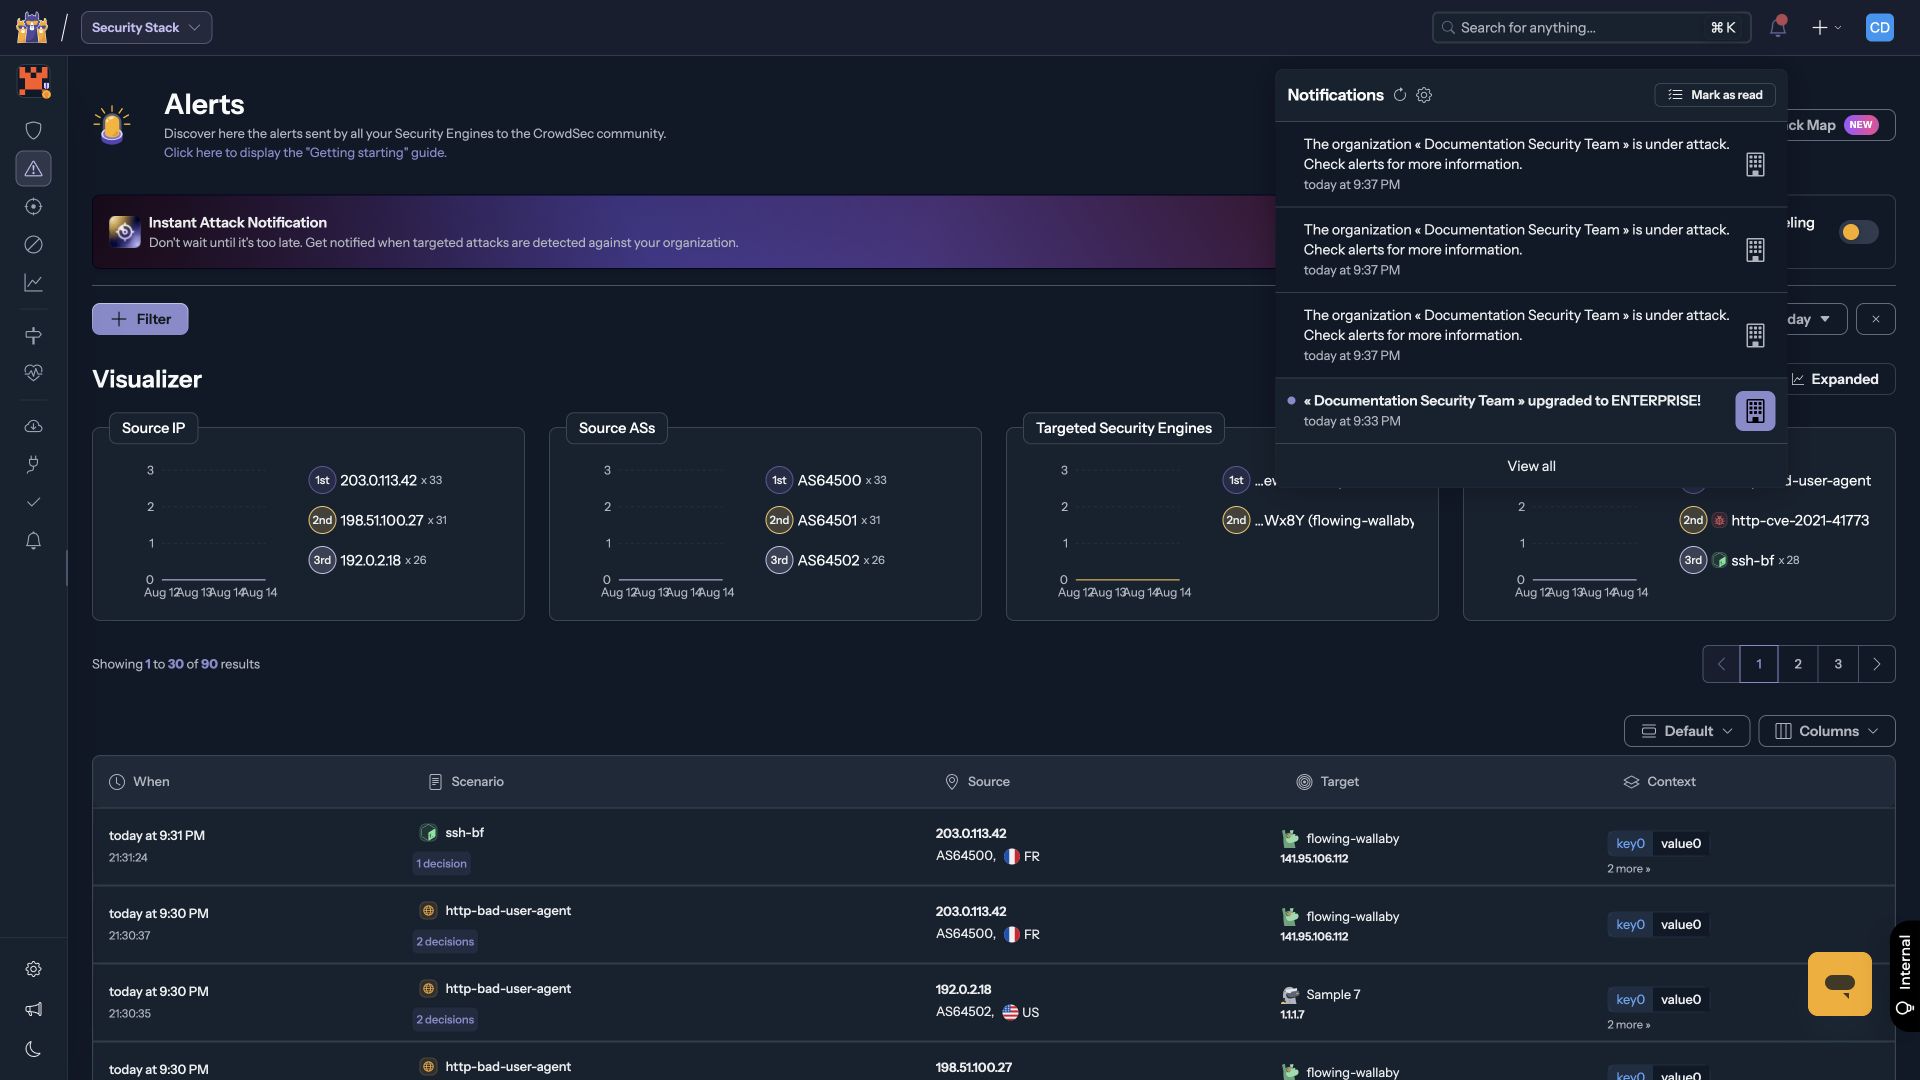
Toggling this feature enables tracking of unusual attack activity across your Security Engines.
When the beginning of a surge is detected, you are notified by email and in-app, and can investigate the contributing alerts from a dedicated dashboard.
Enabling attack surge monitoring
The feature can be toggled from two places in the Security Stack section:
- Alerts dashboard
- Attack Surge Dashboard

The button shows the current toggle status; clicking it changes the state and updates the button text accordingly.
What happens when a surge is detected
When a surge is detected, two notifications are sent simultaneously:
- Email to the organization owner's account: summarizes the surge with a direct link to the Attack Surge Dashboard.
- In-app notification: visible in the notification center; click it to open the dashboard immediately.
Review the Attack Surge Dashboard
You'll find Attack Surges in the side menu of the Security Stack section.
All data on this dashboard is scoped to a selected time period.
Set the period first using the date picker (top-right), and optionally pick a Security Engine, so every number you see is already scoped to the context you want to investigate.
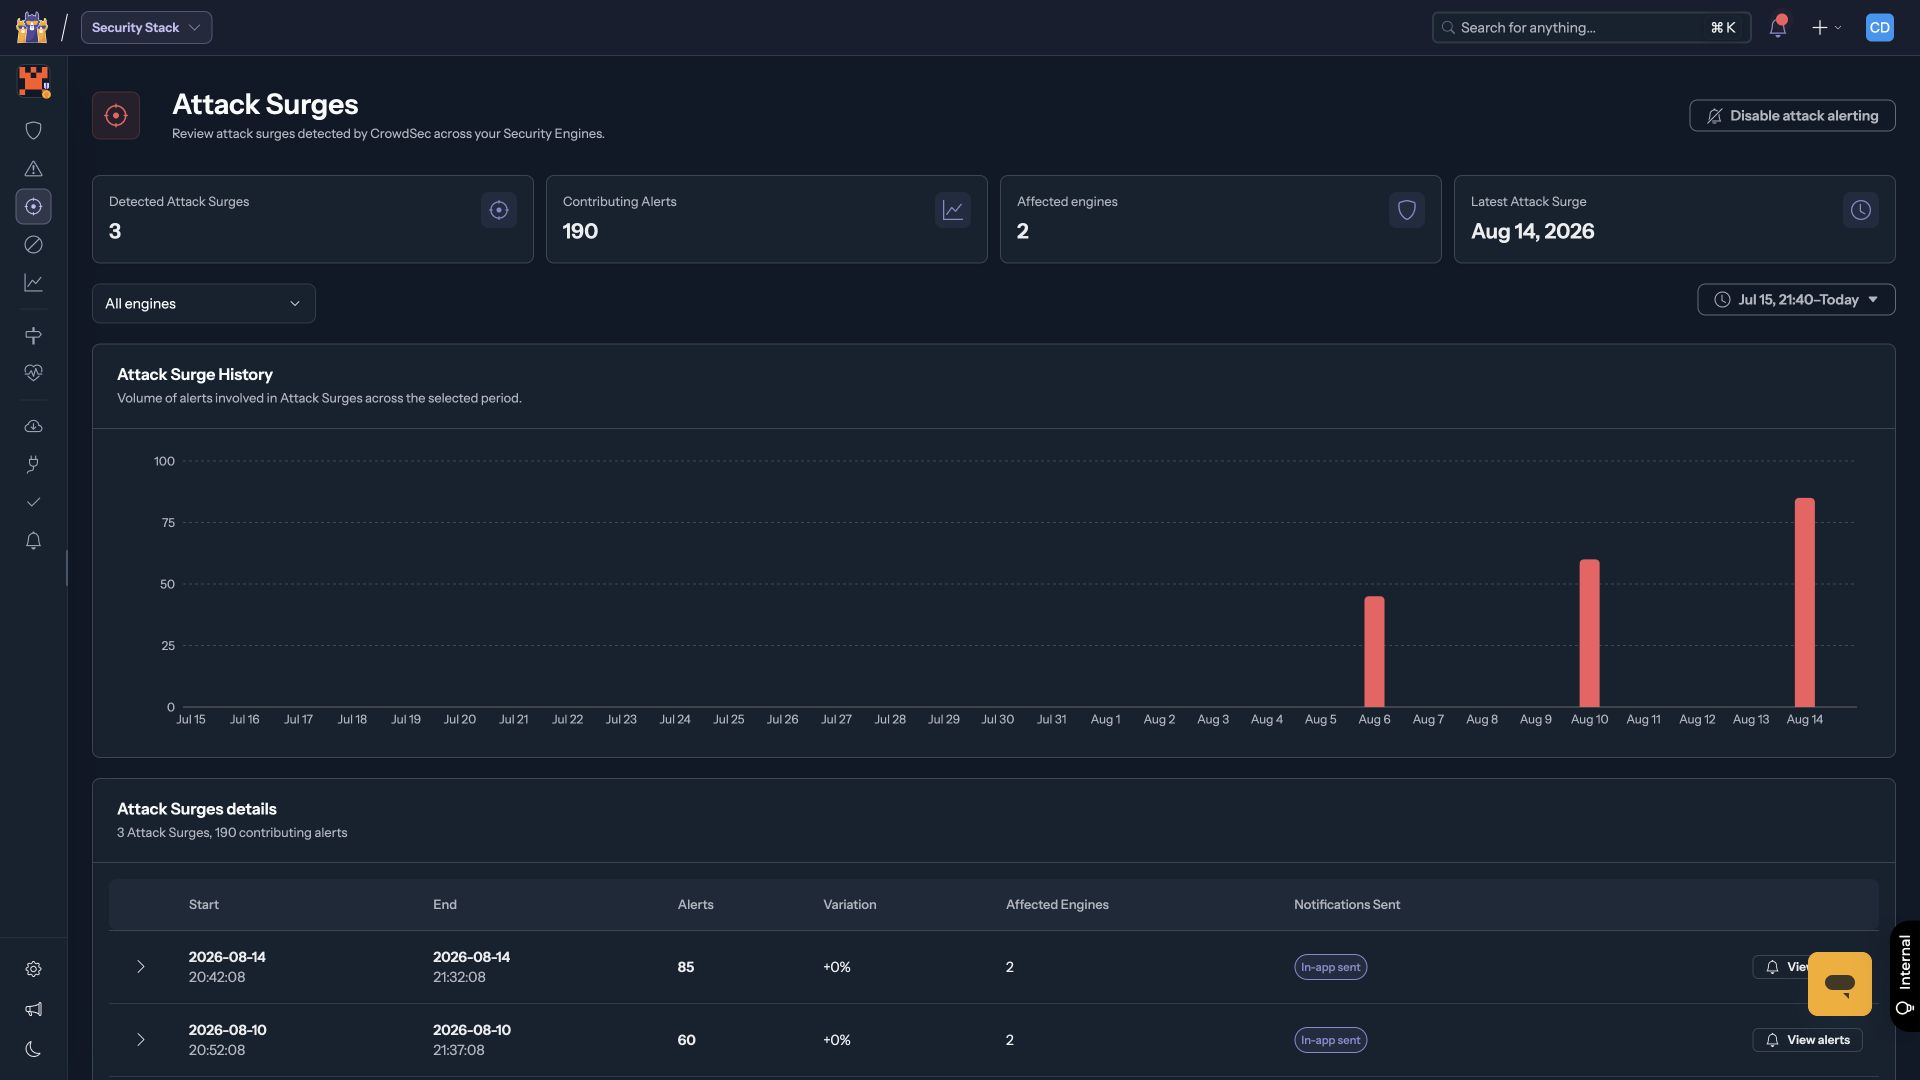
The four KPI cards reflect counts for the selected period:
| Metric | Description |
|---|---|
| Detected Attack Surges | Number of surges identified |
| Contributing Alerts | Total alerts grouped into those surges |
| Affected Engines | Number of Security Engines involved |
| Latest Attack Surge | Date of the most recent surge |
The Attack Surge History bar chart shows alert volume for each surge over time.
Click and drag across a range of bars to zoom into a sub-period; the dashboard updates to show only the surges within that selection.
Inspect an Attack Surge
The Attack Surges details table lists each surge with start/end times, alert count, variation, affected engines, and notification status.
Click the expand arrow on any row in the details table to open the breakdown for that surge.
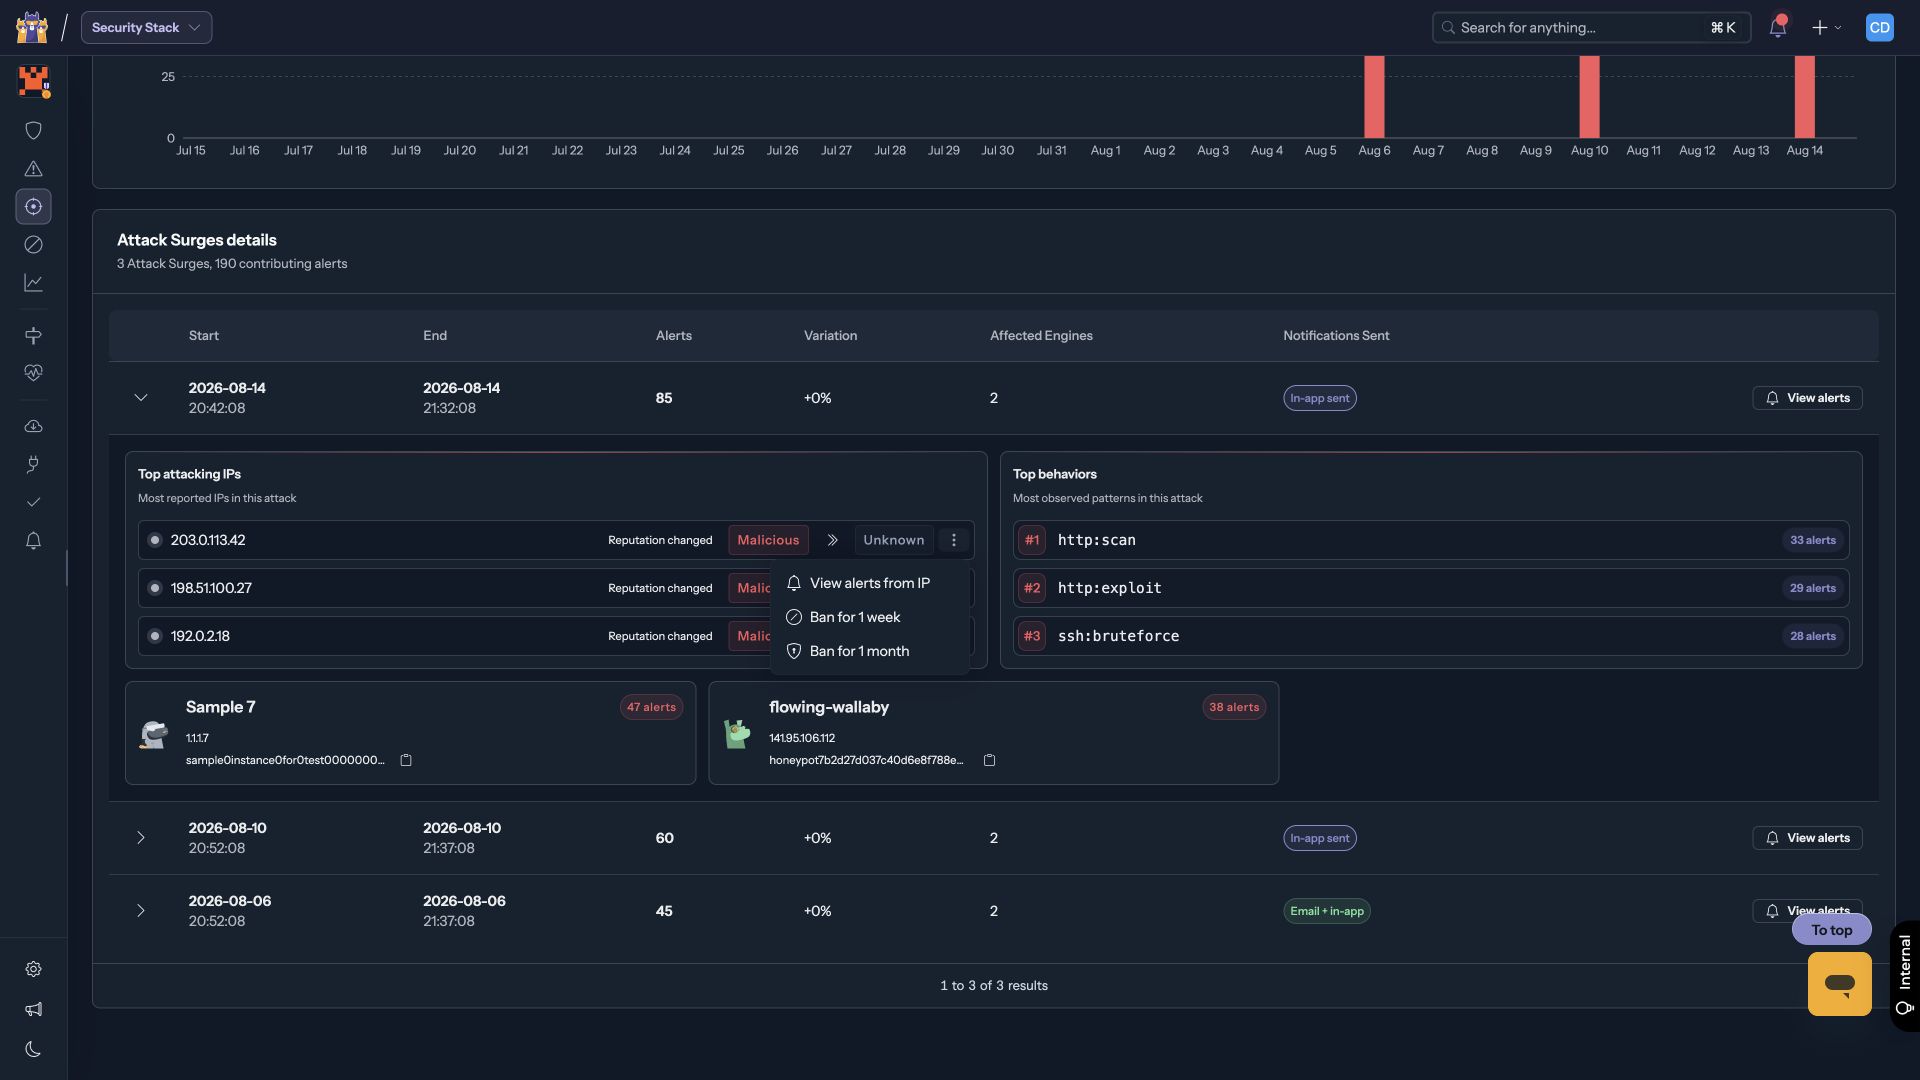
The breakdown has three panels:
- Top attacking IPs: the most active source IPs and the reputation CrowdSec observed during the surge.
- Top behaviors: the most observed attack patterns and their contributing alert counts.
- Affected Security Engines: each engine and the number of alerts it received.
IP quick actions: open the three-dot menu next to any attacking IP to:
- View IP on CrowdSec CTI: jump to the IP's full threat intelligence page.
- Ban for 1 week or Ban for 1 month: create a block decision immediately (available to Editors, Admins, and Owners).
Drill down into contributing alerts
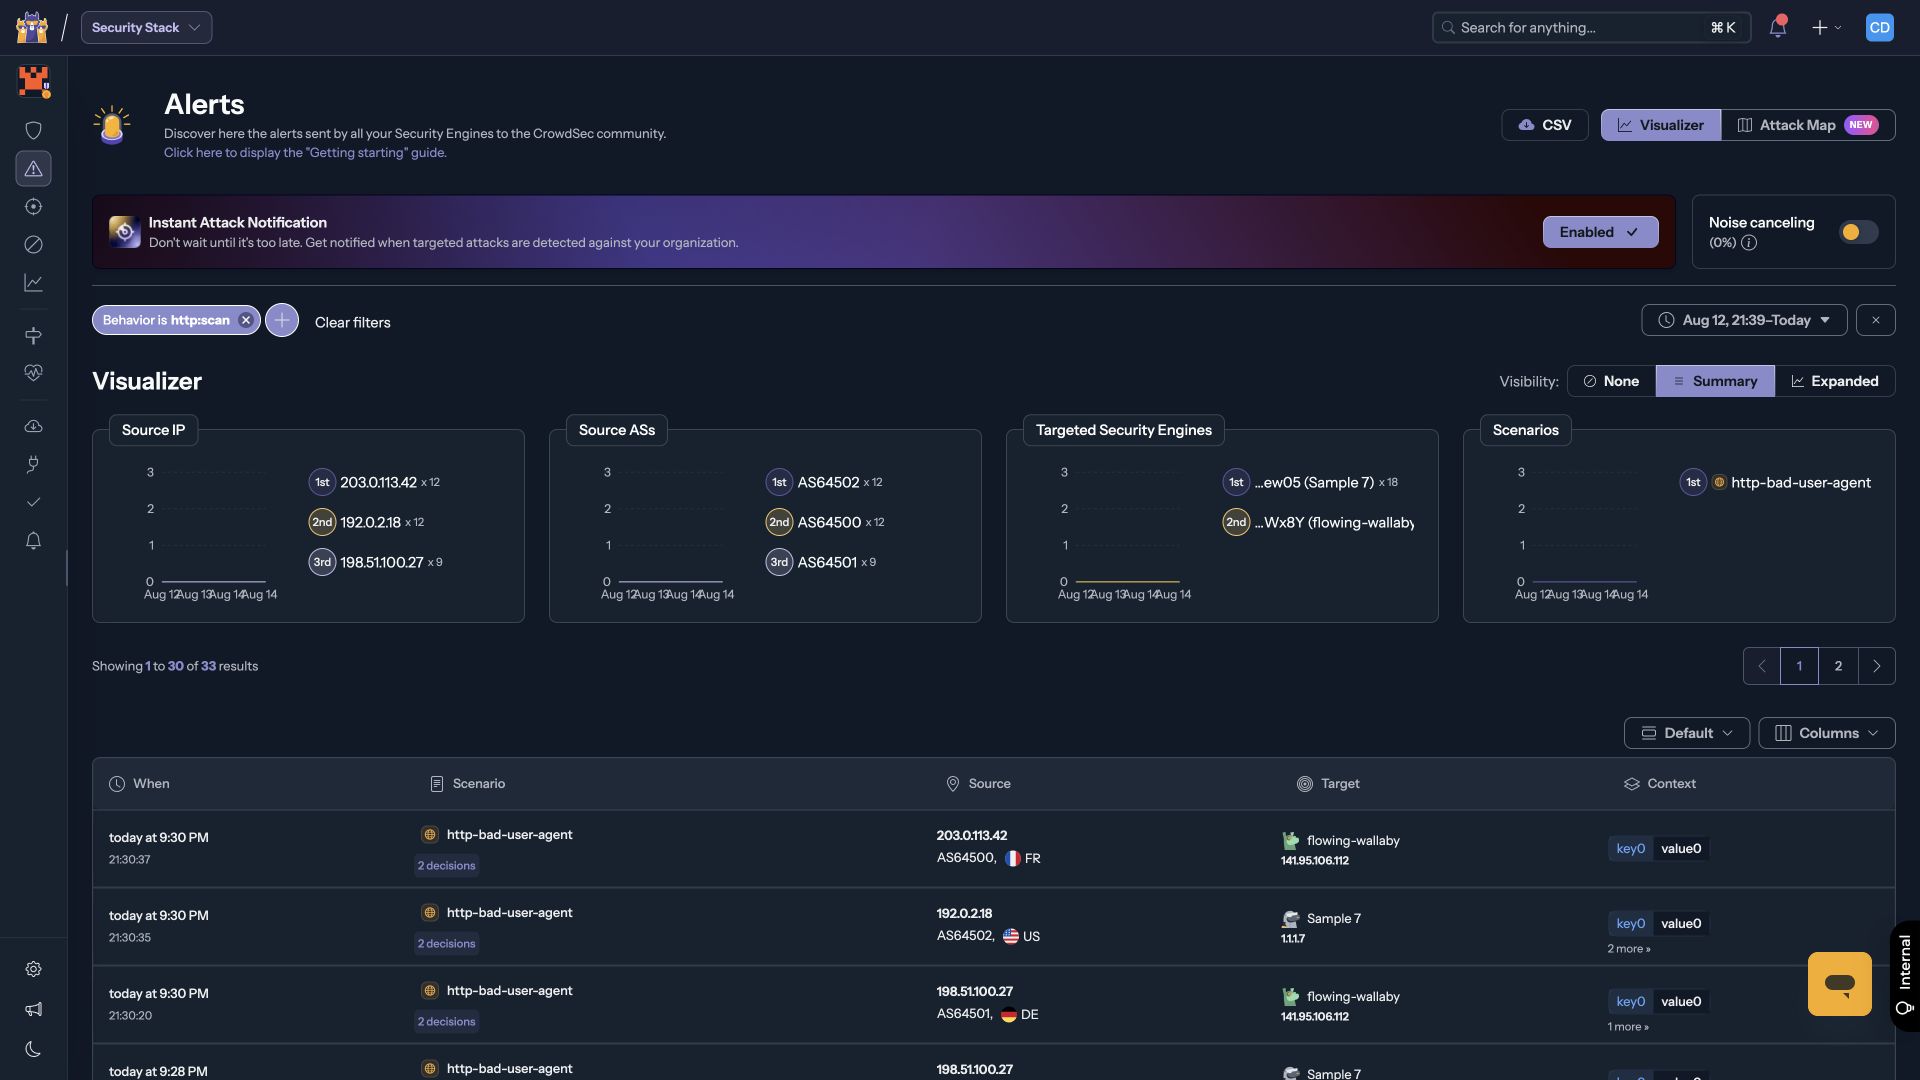
From an expanded surge, click View alerts, the Alerts page opens with the surge's time period and involved Security Engines applied automatically as filters, placing you directly on the relevant alerts.
You can also click any individual attacking IP, behavior, or Security Engine in the expanded details to add it as an extra filter and focus the view further.
The active filters appear above the Alerts visualizer and table so you always see exactly what is scoped in.
Investigate a surge 💡
Use the following checks to quickly understand what happened and decide whether further action is needed.
Identifying something unusual may help you check if your services are in danger or if it's just a temporary spike in background activity.
For example:
- Unusual bruteforce? Check your user activity logs don't show weird behaviors.
- Unusual scanning? Check the targeted paths are not known for vulnerabilities or sensitive data.
1. Understand the scope
Start with the high-level numbers before going deeper:
- How unusual is it?
- Compare surge activity with the attack types and eventually context of the alerts you normally see on this/these Security Engine(s).
- Is it performing bruteforce when you usually only see scanning activity?
- Is it scanning a path that is sensitive or rarely accessed?
- How many source IPs are involved? And How many Security Engines are affected?
- Is there a similarity in the affected services you're protecting ? (all your websites, specifically wordpress ...)
- Is it a single source IP or a large number of them responsible for this surge?
- How long has the activity lasted?
- Check whether the surge was short-lived or whether the signal rate remains elevated.
- A surge instance represents a period of unusual activity, uninterrupted for at least 15 minutes.
- Keep an eye as the surge period might still be going on.
2. Identify what attackers are trying to do
Review the scenarios responsible for the surge and the services/context they target. Look for:
- A single scenario suddenly generating most of the activity;
- Attack types that are unusual for this Security Engine;
- Several related scenarios that may represent different stages of the same attack;
- Repeated targeting of a specific service, application, port, hostname, or path.
- Context information that may be critical: recognizing a username in a bruteforce attempt...
The type of activity should guide the rest of your investigation.
3. Check whether sources are being remediated
Verify that CrowdSec has active decisions for the IPs involved, and that your remediation component is connected, healthy, and applying those decisions. A CrowdSec decision alone does not guarantee that traffic is blocked at the target.
Pay particular attention to:
- Security Engines without an associated remediation component;
- Source IPs without an active decision;
- Decisions that expired while activity is still ongoing;
- Unusual differences between detected signals and the remediation you expect to be in place.
If some attacking sources are not covered, investigate why before deciding whether additional remediation is necessary.
4. Look for signs that an attack succeeded
CrowdSec detects malicious behavior but cannot confirm whether it had an effect. Use your application, authentication, system, WAF, proxy, or SIEM logs to determine whether any attack resulted in a successful action.
| Activity observed | Useful follow-up checks |
|---|---|
| Brute force / credential stuffing | Successful logins from attacking IPs, new accounts, password or MFA changes, suspicious sessions |
| Web crawling / reconnaissance | Sensitive paths accessed, admin endpoints, config or backup files, unexpected HTTP 200 responses |
| Vulnerability exploitation | Targeted product/version in your stack, successful requests, unusual processes, file changes, errors after requests |
| Scanning / probing | Exposed services or ports that should not be public, unexpected responses from internal services |
| API abuse | Successful requests, unusual tokens or users, rate spikes, enumeration of objects, unexpected data access |
| Bot activity / scraping | High-value endpoints scraped, unusual request rates, resource consumption, bypass of auth or rate limits |
5. Compare with your usual attack profile
An increase in familiar background activity may need less attention than a completely new pattern. Ask yourself:
- Is this scenario normally seen on this Security Engine?
- Is the proportion of this attack type significantly higher than usual?
- Are attackers targeting a service that is rarely attacked?
- Is the same activity appearing simultaneously across several systems?
A change in attack type can sometimes be more significant than a change in raw signal volume.
6. Prioritize the most relevant sources
You do not need to inspect every source individually. Prioritize IPs that:
- generated the most signals;
- triggered several different scenarios;
- are still active;
- are not currently covered by remediation;
- targeted particularly sensitive services;
- appear repeatedly across several Security Engines.
Use CrowdSec CTI (via the IP quick-action menu) or your usual threat-intelligence sources when additional context about a source can help qualify the activity.
7. Continue monitoring after the surge
After taking any necessary action, continue monitoring the affected systems. Check whether:
- the signal rate returns to its normal level;
- the same sources return after remediation expires;
- the attack changes technique or moves to another service;
- similar activity appears on other Security Engines.
If the surge persists, changes behavior, or you find evidence of successful access, escalate using your normal incident-response process.